
Latest Information Technology Salary Survey
2025 survey includes data for key AI and ML positions - including CAIO
IT Pros see an improvement in pay
Latest Information Technology Salary Survey - Are you paying too much or too little to your information technology staff? Are you earning what you're worth? Whether employer or employee, it is important to know what other companies are paying in total compensation for a similar position in your area. Learn how your company compares in the area of compensation. Data as of January 2025.
The Janco Associates, Inc. and eJobDescription.com salary survey draws on data collected throughout the year by extensive internet-based and completed survey forms sent to businesses throughout the United States and Canada.
Over 300 companies participate in the survey.
The latest Salary Survey is greate news for IT Professionals. The survey shows that hiring has picked up in some sectors of the IT job market, salaries for the most part remain flat, however for selected positions there has been an increase in compensation. Even though many fear a second dip in the economy, CIOs in larger enterprises have been give the ‘yellow light’ to look ahead and fill positions that were left unfilled last year., The same is not the case for mid-sized companies. They are much more cautious and concerned that the recovery will not be strong enough to support increased IT spending. In follow-up interviews of the participants we found that CIOs are starting their planning processes with the assumptions that the economy will improve in the first part of next year. If that holds true them hiring and compensation should pick up.
Order IT Salary Survey Download IT Salary Survey Summary Provide IT Salary Survey Data
Summary Findings
IT Median Salaries Current Data
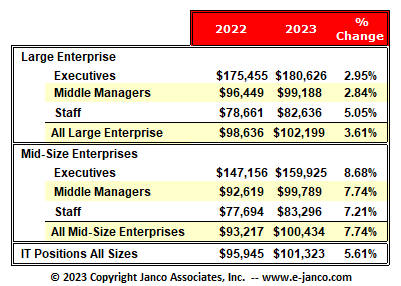
We have replaced the prior chart with the one from the latest IT Salary Survey.This was done in order to provide the best information possible. Prior to doing that the various search engines would not place our data in high ranking search engine positions.
The most striking observations of our latest survey are:
- Bonuses were all but eliminated
- Salary increases were minimal at best
- 116,000 IT professionals were laid-off or terminated in April and May due to the Covid-19 shut-down
- There were over 84,000 fewer IT Jobs in December than at the start of the year
- The second wave of shutdowns slowed the recovery in the IT job market with an additional 8,000 plus jobs eliminated
- Between January 2020 and January 2021, the total mean compensation for all IT Professionals increased from $94,535 to $94,609 or 0.08%.
- Most of the increases were limited to 1% or less
- Hiring has all but stopped for all IT positions.
- Consultants who augment IT Staff have all but been eliminated
- Demand has remained highest for IT professionals who support Work From Home (WFH) and e-commerce
- KPI metrics are the focus of C-Level management to understand and manage WFH employees.
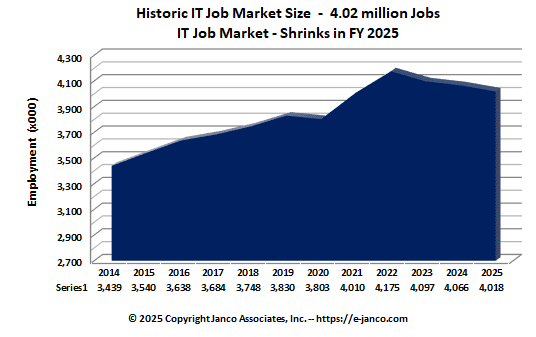
Historic IT Job Market Size
Updated with current data
For current data go IT Job Market Size to see the historic job market growth trend detail data
Subscribe to our Newsletter to get this information delivered to your inbox as soon as it is released. SUBSCRIBE
The Janco Associates, Inc. salary survey draws on data collected throughout the year by extensive interviews, internet-based survey data, and survey forms completed by businesses throughout the United States and Canada.
The compensation study (in PDF or WORD and EXCEL with the data) can be ordered here.
Order IT Salary Survey Download IT Salary Survey Summary
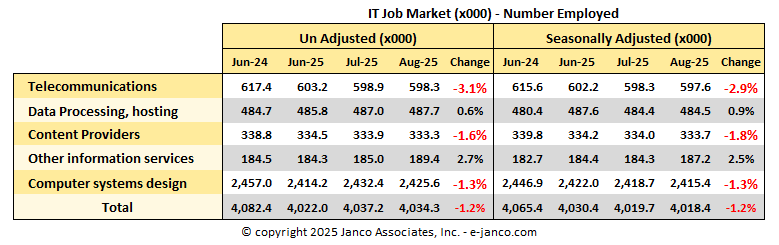
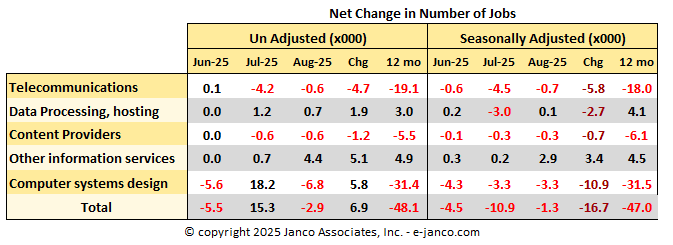
National Employment Report Job Market for IT Pros

Subscribe to our Newsletter to get this information delivered to your inbox as soon as it is released. SUBSCRIBE
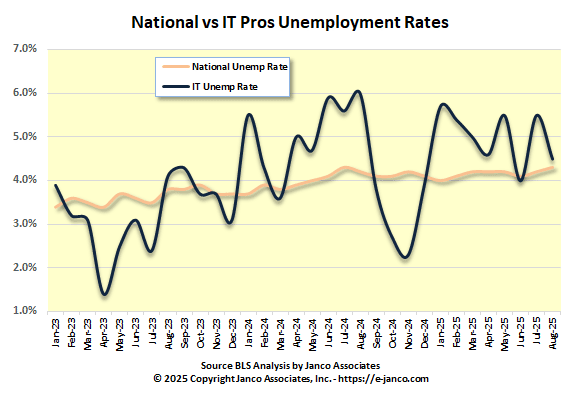
The national employment data from the Bureau of Labor Statistics validates the findings of the Janco and eJobDescription.com salary survey that the overall IT employment picture has stabilized and is improving in all areas except for telecommunication and hosting providers -- the primary areas where Outsourcing has had the greatest impact.
Covid-19 Impact on Hiring
The 3 month moving average for growth of IT jobs falls slightly for IT Pros..
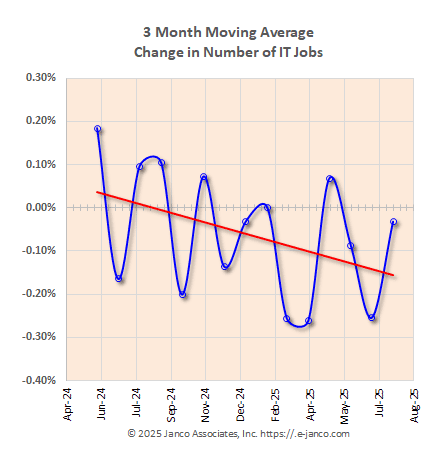
Updated with the most recent information
for current analysis see IT Job Market Data
Subscribe to our Newsletter to get this information delivered to your inbox as soon as it is released. SUBSCRIBE
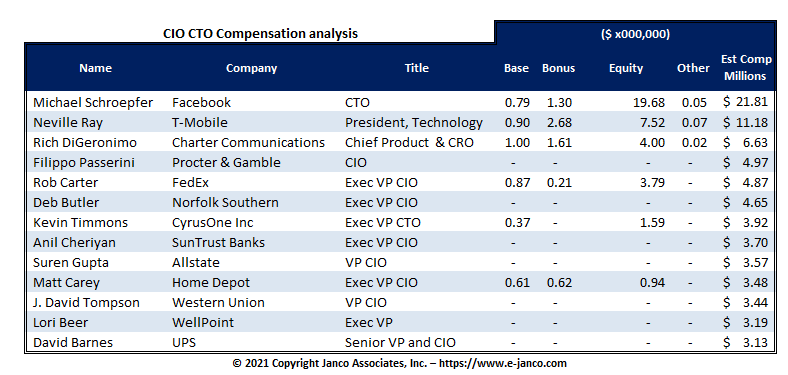
Fortune 500 Top IT Executive Compensation
This is the total compensation for some senior IT executives at Fortune 500 companies, but it's NOT a ranking of the highest paid CIOs and CTOs. A public company is only obligated to report the compensation of its principal executive officer (usually the CEO), principal financial officer (CFO) and its three most highly compensated officers. If a senior IT leader ranks among a company's three most highly paid executives, that CIOs' or CTOs' compensation is reported in the organization's annual proxy statement.
This table includes instances where a CIO or CTO is included among the named executive officers. However, a CIO or CTO might have earned a multi-million-dollar pay package, but if more than three executives at the company topped that amount, that IT leader's compensation data is not disclosed. There are undoubtedly higher paid IT chiefs whose compensation is not publicly reported and therefore they are not included in this table.
IT Salary Survey Purchase Options
You can order the IT Salary Survey for an individual city or for all of North America (Canada and the United States) with or with out data in Excel sheet format and with or with full multi page job descriptions for the positions surveyed. Or you can order the survey as part of our IT Resource Hiring Kit with full job descriptions for all 300 positions in the Internet and IT Position Descriptions HandiGuide.
Learn how your company compares in the area of compensation.
The Janco Associates, Inc. salary survey draws on data collected throughout the year by extensive Internet-based and completed survey forms sent to businesses throughout the United States and Canada. Our database contains over 50,000 data points.
The 159-page compensation study summarizes and compares data from 78 American metropolitan areas and 23 Canadian cities. Delivered in PDF format, it provides comparative information on more than 70 specific job titles:
- Five distinct IT executive positions
- Three director-level jobs
- More than 15 specific manager roles
- Dozens of technical staff positions
Historical Data
The BLS report for the last few months the number of individuals employed in IT has increased (seasonally adjusted) in the last 12 months.
Subscribe to our Newsletter to get this information delivered to your inbox as soon as it is released. SUBSCRIBE
Based on this data and interviews that Janco has conducted. Janco predicts there will be more churn in IT staff as CIOs accelerate their move to more flexible staffing models. CIOs are outsourcing more technical work, including managed IP services such as VoIP and VPNs. They are hiring more contractors for desktop and security services, and they are putting more applications such as remote backup in the cloud. At the same time, they are looking to hire IT people with business and analytical skills, such as risk management and project management. CIOs report that they're having trouble hiring IT people because either they can't find IT professionals with the right business skills or they can't afford them. All of this means more turnover in IT departments.
Despite recent economic reports that show jobless claims have been down for several consecutive weeks, employees reveal mixed feelings about what is in store at their employer, for the overall job market and for their pay check in the year ahead, according to the fourth-quarter employment confidence survey of 2,118 U.S. adults. The survey found employees are more confident in their job security and company's outlook in the next six months than in the third quarter. However, employees have also remained pessimistic about pay raises and grown more uncertain about the job market since the third quarter.
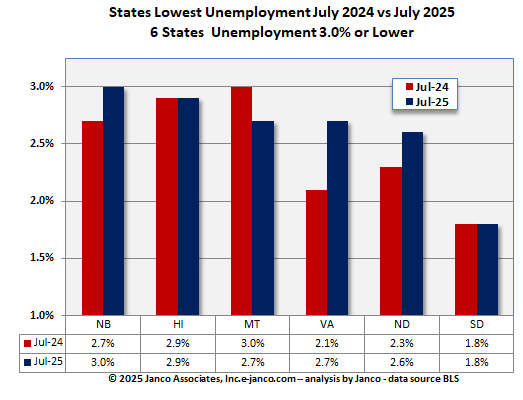
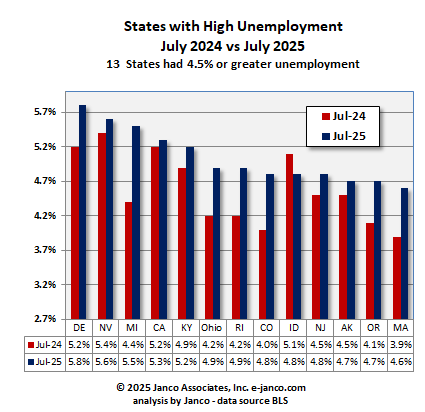
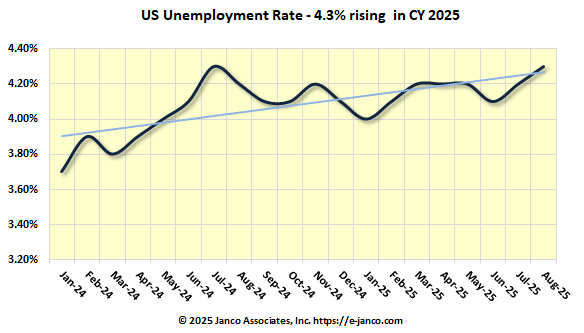
Unemployment Data
High unemployment states for the most part have improved. The West continued to have the highest regional unemployment rate, 7.5 percent, while the South again had the lowest rate, 6.0 percent. Over the month, only the Midwest had a statistically significant unemployment rate change (-0.1 percentage point). Significant over-the-year rate declines occurred in all four regions: the South (-1.2 percentage points), Northeast (-1.1 points), West (-1.0 point), and Midwest (-0.8 point).
Subscribe to our Newsletter to get this information delivered to your inbox as soon as it is released. SUBSCRIBE
Subscribe to our Newsletter to get this information delivered to your inbox as soon as it is released. SUBSCRIBE
During the recession of 2009 - 2014 unemployment in the IT Industry had not been as high as the rest of the United States. Older workers had a higher unemployment rate than your ones. In addition, female high tech employees have not as well as their male counterparts. This is especially true for workers over the age of 55. The unemployment rate for women over the age of 55 for computer and math workers in 2010 was 9.4% versus 8.0% for men.
Subscribe to our Newsletter to get this information delivered to your inbox as soon as it is released. SUBSCRIBE
Cities Included in IT Salary Survey
Janco's IT Salary Survey includes the following 78 United States cities, as well as 23 selected cities in Canada
Order IT Salary Survey Download IT Salary Survey Summary
US Cities Included;; Order US Cities
| Akron | Albuquerque | Allentown | Anchorage |
| Atlanta | Atlantic City | Austin | Baltimore |
| Bellingham | Boise | Boston | Buffalo |
| Charleston | Charlotte | Cheyenne | Chicago |
| Cincinnati | Cleveland | Colorado Springs | Columbus |
| Dallas | Denver | Des Moines | Detroit |
| Duluth | Gary | Grand Rapids | Green Bay |
| Honolulu | Houston | Indianapolis | Kansas City, MO |
| Las Vegas | Lexington | Little Rock | Los Angeles |
| Louisville | Madison | Memphis | Miami |
| Milwaukee | Minneapolis | Nashville | New Orleans |
| New York | Oakland | Oklahoma City | Olympia |
| Omaha | Orange County CA | Orlando | Peoria |
| Philadelphia | Phoenix | Pittsburgh | Portland, ME |
| Portland, OR | Provo/Orem | Raleigh-Durham | Rockford |
| Sacramento | Salt Lake City | San Antonio | San Diego |
| San Francisco | San Jose | Seattle | Sioux Falls |
| St. Louis | Stamford | Syracuse | Toledo |
| Topeka | Tucson | Tulsa | Washington |
| Wichita | Winston-Salem |
Canadian Cities Included; Order Canadian Cities
| Calgary, AB | Charlotte, PE | Edmonton, AB | Fredericton, NB |
| Guelph, ON | Halifax, NS | Hamilton, ON | Hull, QC |
| London, ON | Montreal, QC | Niagara Falls, ON | Ottawa, ON |
| Quebec City, QC | Regina, SK | Saskatoon, SK | St. John's, NF |
| Sudbury, ON | Toronto, ON | Vancouver, BC | Victoria, BC |
| Whitehorse, YT | Windsor, ON | Winnipeg, MB | |
| ; | |||
Job Titles Included in IT Salary Survey
Janco's Salary Survey includes the following the job titles in its IT Salary Survey.
Order IT Salary Survey Download IT Salary Survey Summary
Executive Management
VP - Chief Information Officer, VP - Chief Security Officer, VP - Administration, VP - Consulting Services, VP - Information Services, VP - Technical Services, Director - IT Planning, Director - Production/Data Center (Operations), Director - Systems & Programming
Middle Management
Manager - Applications, Manager - Computer Operations, Manager - Customer Service, Manager - Data Communications , Manager - Database , Manager - Information Center, Manager - Internet Systems, Manager - Network Services, Manager - Op Systems Prod, Manager - Production Services, Manager - Production Support, Manager Quality Control, Manager - Security and Workstations, Manager - Systems and Programming, Manager - Technical Services, Manager - Training Documentation, Manager - Voice Data Communication, Capacity Planning Supervisor, Change Control Supervisor, Computer Ops - Shift Manager, Computer Ops - Shift Supervisor, Data Entry Supervisor, Production Control Specialist, Production Services Supervisor, Project Manager - Applications , Project Manager - Distributed Systems, Project Manager - Network Techical Services, Project Manager - Systems, Supervisor - Hardware Installations, Supervisor - Desktop Support, Supervisor - Network Services, Voice/Wireless Communications Manager, Webmaster
Staff
Change Control Analyst, Computer Operator, Data Center Facility Administrator, Data Entry Clerk, Data Security Administrator, Database Specialist, Disaster Recovery Coordinator, e-Commerce Specialist, Forms and Graphics Designer, Hardware Installations Coordinator, Internet developr, IT Planning Analyst, LAN Applications Support Analyst, Librarian, Network Control Analyst, Network Services Administrator, Network Technician, Object Programmer, Operations Analyst, Personal Computer Specialist, Production Control Analyst, Programmer/Analyst, Senior Network Specialist, Software Engineer, Systems Analyst, Systems Programmer, Systems Support Specialist, Technical Services Specialist, Technical Specialist, Voice/Wireless Communications Coordinator, Web SEO Analyst
IT Salary Survey Methodology
From the Janco Associates, Inc. database, compensation benchmark ranges are established for each normalized job position. In analyzing the study data, the upper and lower quartiles are eliminated to determine Benchmark Ranges. The benchmark ranges are then used to assess the alignment of a company's actual compensation to the marketplace for each job function. The results can be assessed using the following guidelines.
The Benchmark represents our assessment of the compensation level required for organizations to remain competitive and minimize the risk of losing employees to other organizations. Reviews were conducted from the standpoint of a comparison o base salary and, when appropriate, from the additional standpoint of total compensation. Total compensation is determined by adding the budgetary bonus amounts and an equivalent cash value for above-standard compensation to an individual's base salary. The compensation Study data was divided into two categories. Large companies are companies whose gross revenues are equal to or greater than $500MM. Mid-sized companies are companies whose gross revenues are less than $500MM.Below Benchmark Range - Highly impacted by forces of the marketplace
Within Benchmark Range - Subject to the normal forces of the marketplace for similar job functions and responsibilities.
Above Benchmark Range - Not subject to the forces of the marketplace
Become A Survey Participant
Janco Associates, Inc. has published a biannual information technology compensation survey for over twenty years.
Participate by providing us valid data and we will be able to download a complimentary copy of the summary results (see Note 1) upon its completion. In addition, you may be eligible to purchase the full study at a significant discount.
These results will be available in July. To participate, simply click the Participate button below and complete the on-line Compensation Participation Survey.
You can either download our participation excel spread sheet1 or click on the link below to enter you data via an on-line survey. (Note: will be able to come back to modify the data you enter for 120 days)
Please be assured that any compensation information provided to us will be held in the strictest confidence.
If you have any questions, please contact us via e-mail at
Contact Janco Associates.
Note 1. You can qualify for a complete free copy of the PDF version of the study, if your enterprise provides at least ten valid data points as determined by Janco. All other participants will qualify for the summary of the study only.
Order IT Salary Survey Download IT Salary Survey Summary Provide IT Salary Survey Data